Note
Go to the end to download the full example code.
Feature Selection on the WHO Dataset#
import numpy as np
import scipy
from matplotlib import pyplot as plt
from sklearn.linear_model import LinearRegression
from sklearn.model_selection import train_test_split

from skmatter.datasets import load_who_dataset
from skmatter.feature_selection import CUR, FPS, PCovCUR, PCovFPS
from skmatter.preprocessing import StandardFlexibleScaler
Load the Dataset#
df = load_who_dataset()["data"]
print(df)
           Country  Year  ...  SN.ITK.DEFC.ZS  NY.GDP.PCAP.CD
0      Afghanistan  2005  ...            36.1      255.055120
1      Afghanistan  2006  ...            33.3      274.000486
2      Afghanistan  2007  ...            29.8      375.078128
3      Afghanistan  2008  ...            26.5      387.849174
4      Afghanistan  2009  ...            23.3      443.845151
...            ...   ...  ...             ...             ...
2015  South Africa  2015  ...             5.2     6204.929901
2016  South Africa  2016  ...             5.4     5735.066787
2017  South Africa  2017  ...             5.5     6734.475153
2018  South Africa  2018  ...             5.7     7048.522211
2019  South Africa  2019  ...             6.3     6688.787271

[2020 rows x 12 columns]
columns = np.array(
    [
        "SP.POP.TOTL",
        "SH.TBS.INCD",
        "SH.IMM.MEAS",
        "SE.XPD.TOTL.GD.ZS",
        "SH.DYN.AIDS.ZS",
        "SH.IMM.IDPT",
        "SH.XPD.CHEX.GD.ZS",
        "SN.ITK.DEFC.ZS",
        "NY.GDP.PCAP.CD",
    ]
)

column_names = np.array(
    [
        "Population",
        "Tuberculosis",
        "Immunization, measles",
        "Educ. Expenditure",
        "HIV",
        "Immunization, DPT",
        "Health Expenditure",
        "Undernourishment",
        "GDP per capita",
    ]
)

columns = columns[[8, 4, 2, 6, 1, 7, 0, 5, 3]].tolist()
column_names = column_names[[8, 4, 2, 6, 1, 7, 0, 5, 3]].tolist()
We are taking the logarithm of the population and GDP to avoid extreme distributions
log_scaled = ["SP.POP.TOTL", "NY.GDP.PCAP.CD"]
for ls in log_scaled:
    print(X_raw[:, columns.index(ls)].min(), X_raw[:, columns.index(ls)].max())
    if ls in columns:
        X_raw[:, columns.index(ls)] = np.log10(X_raw[:, columns.index(ls)])
y_raw = np.array(df["SP.DYN.LE00.IN"])  # [np.where(df['Year']==2000)[0]])
y_raw = y_raw.reshape(-1, 1)
X_raw.shape
149841.0 7742681934.0
110.460874721483 123678.70214327476

(2020, 9)
Scale and Center the Features and Targets#
x_scaler = StandardFlexibleScaler(column_wise=True)
X = x_scaler.fit_transform(X_raw)

y_scaler = StandardFlexibleScaler(column_wise=True)
y = y_scaler.fit_transform(y_raw)

n_components = 2

X_train, X_test, y_train, y_test = train_test_split(
    X, y, test_size=0.3, shuffle=True, random_state=0
)
Provide an estimated target for the feature selector#
kernel_params = {"kernel": "rbf", "gamma": 0.08858667904100832}
lr = LinearRegression(fit_intercept=False)


yp_train = lr.fit(X_train, y_train).predict(X_train)
Compute the Selections for Each Selector Type#
PCov-CUR#
  0%|          | 0/9 [00:00<?, ?it/s]
100%|██████████| 9/9 [00:00<00:00, 229.67it/s]
PCov-FPS#
  0%|          | 0/8 [00:00<?, ?it/s]
100%|██████████| 8/8 [00:00<00:00, 9391.11it/s]
CUR#
  0%|          | 0/9 [00:00<?, ?it/s]
100%|██████████| 9/9 [00:00<00:00, 952.46it/s]
FPS#
  0%|          | 0/8 [00:00<?, ?it/s]
100%|██████████| 8/8 [00:00<00:00, 8719.97it/s]
(For Comparison) Recursive Feature Addition#
class RecursiveFeatureAddition:
    """Class for recursive feature addition"""

    def __init__(self, n_to_select):
        """Init."""
        self.n_to_select = n_to_select
        self.selected_idx_ = np.zeros(n_to_select, dtype=int)

    def fit(self, X, y):
        """Perform the fit."""
        remaining = np.arange(X.shape[1])
        for n in range(self.n_to_select):
            errors = np.zeros(len(remaining))
            for i, pp in enumerate(remaining):
                lr.fit(X[:, [*self.selected_idx_[:n], pp]], y)
                errors[i] = lr.score(X[:, [*self.selected_idx_[:n], pp]], y)
            self.selected_idx_[n] = remaining[np.argmax(errors)]
            remaining = np.array(np.delete(remaining, np.argmax(errors)), dtype=int)
        return self


rfa = RecursiveFeatureAddition(n_select).fit(X_train, y_train)
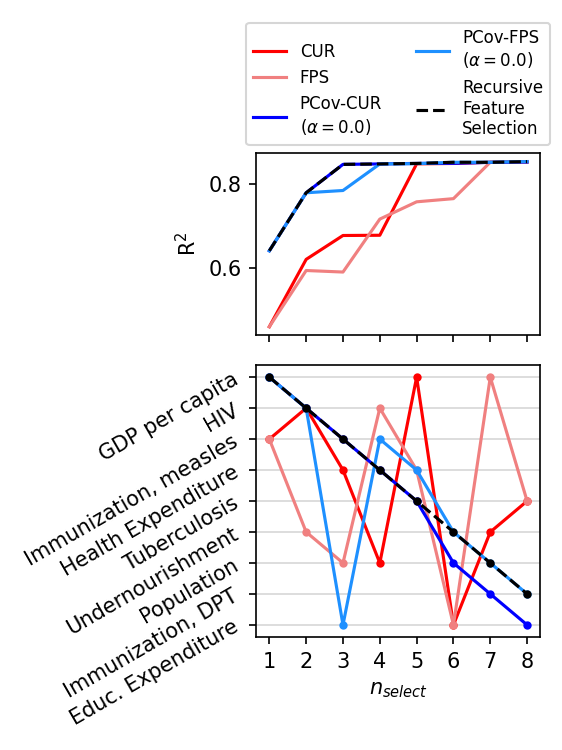
Plot our Results#
fig, axes = plt.subplots(
    2,
    1,
    figsize=(3.75, 5),
    gridspec_kw=dict(height_ratios=(1, 1.5)),
    sharex=True,
    dpi=150,
)
ns = np.arange(1, n_select, dtype=int)

all_errors = {}
for selector, color, linestyle, label in zip(
    [cur, fps, pcur, pfps, rfa],
    ["red", "lightcoral", "blue", "dodgerblue", "black"],
    ["solid", "solid", "solid", "solid", "dashed"],
    [
        "CUR",
        "FPS",
        "PCov-CUR\n" + r"($\alpha=0.0$)",
        "PCov-FPS\n" + r"($\alpha=0.0$)",
        "Recursive\nFeature\nSelection",
    ],
):
    if label not in all_errors:
        errors = np.zeros(len(ns))
        for i, n in enumerate(ns):
            lr.fit(X_train[:, selector.selected_idx_[:n]], y_train)
            errors[i] = lr.score(X_test[:, selector.selected_idx_[:n]], y_test)
        all_errors[label] = errors
    axes[0].plot(ns, all_errors[label], c=color, label=label, linestyle=linestyle)
    axes[1].plot(
        ns, selector.selected_idx_[: max(ns)], c=color, marker=".", linestyle=linestyle
    )

axes[1].set_xlabel(r"$n_{select}$")
axes[1].set_xticks(range(1, n_select))
axes[0].set_ylabel(r"R$^2$")
axes[1].set_yticks(np.arange(X.shape[1]))
axes[1].set_yticklabels(column_names, rotation=30, fontsize=10)
axes[0].legend(ncol=2, fontsize=8, bbox_to_anchor=(0.5, 1.0), loc="lower center")
axes[1].invert_yaxis()
axes[1].grid(axis="y", alpha=0.5)
plt.tight_layout()
plt.show()
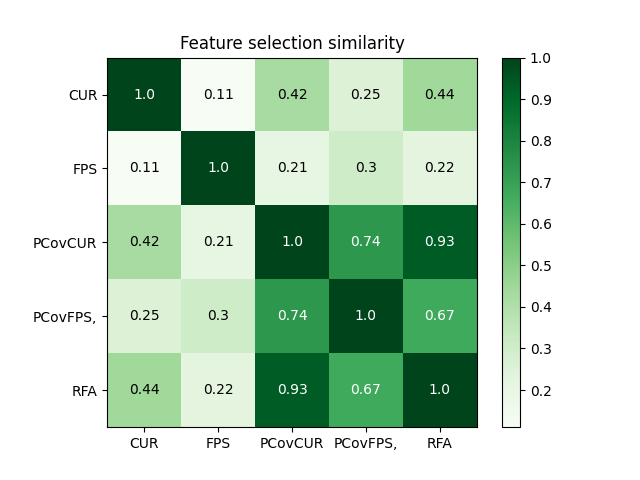
Plot correlation between selectors#
selected_idx = np.array(
    [selector.selected_idx_ for selector in [cur, fps, pcur, pfps, rfa]]
).T

similarity = np.zeros((len(selected_idx.T), len(selected_idx.T)))
for i in range(len(selected_idx.T)):
    for j in range(len(selected_idx.T)):
        similarity[i, j] = scipy.stats.weightedtau(
            selected_idx[:, i], selected_idx[:, j], rank=False
        )[0]

labels = ["CUR", "FPS", "PCovCUR", "PCovFPS,", "RFA"]

plt.imshow(similarity, cmap="Greens")
plt.xticks(np.arange(len(labels)), labels=labels)
plt.yticks(np.arange(len(labels)), labels=labels)

plt.title("Feature selection similarity")
for i in range(len(labels)):
    for j in range(len(labels)):
        value = np.round(similarity[i, j], 2)
        color = "white" if value > 0.5 else "black"
        text = plt.gca().text(j, i, value, ha="center", va="center", color=color)

plt.colorbar()
plt.show()